Death Certificates

Related Content

The Consumption and Consequences of Alcohol, Tobacco, and Drugs in Indiana: A State Epidemiological Profile: 2018

Substance use continues to be a major public health concern, negatively impacting a variety of health, legal, and social outcomes. Nearly one-fourth of Hoosiers ages 12 and older engaged in binge drinking in the past month and one-tenth used an illicit substance. Furthermore, 7% of Indiana residents met criteria for substance use disorder (SUD) in the past year and 6.5% needed but did not receive treatment for their SUD.

Of particular concern is polysubstance use, or the use of two or more substances over a defined period, simultaneously or at differing times, for recreational purposes. In over 70% of admissions to substance use treatment in Indiana, the use of multiple substances was indicated, with 30% reporting the use of two drugs and nearly 41% reporting the use of three drugs.

During state fiscal year 2018, a total of 10,483 children were removed from their parents by the Department of Child Services in Indiana; almost two-thirds (64%) of these removals were due to parental alcohol and/or drug use.

Opioid Overdose Fact Sheet (Marion County, 2010-2017)

This fact sheet describes opiod overdose and illustrates that Marion County: has higher or similar rates of overdose deaths than many other counties; had an increasing rate of opoid overdose deaths in recent years; and had a majority of overdose deaths involving opioids, DR3788.

Overdose Fact Sheet (Marion County, 2010-2017)

This fact sheet on overdoses shows that Marion County has: higher rates of overdose that many other counties; an increasing rate of overdoses in recent years; and that a majority of overdose deaths involved opioids, DR3788.

DR3737 MCPHD 2016-2017 community report tablesDR3737 MCPHD 2016-2017 community report natality & infant mortality tables.doc

Neonatal and infant mortality rates among racial/ethnic minority residents were higher than among White residents of Marion County during 2016 and 2017. Black residents carried the highest burden of disease with rates more than twice that of White residents (DR3737).

Homicide Rate by Gender (Marion County, 2012-2014)

In Marion County, the homicide rate among males was consistently higher than that of females between 2012 and 2017. In 2017, the homicide rate among males was approximately four times higher than that of females, DR3774.

Homicide Rate by Race (Marion County, 2012-2017)

A racial inequity in homicide rates persisted between 2012 and 2017 such that non-Hispanic blacks experience higher homicide rates comapred to non-Hispanic whites. In 2017, the homicide rate of non-Hispanic blacks was approximately six times higher than that of non-Hispanic whites (DR3774).

Domestic Violence Fact Sheet (Marion County, 2009-2016)

The rate of domestic violence (intimate partner violence) in Marion County was nearly four-fold the national rate in 2016 and young women, particularly African American women, are at greatest risk, DR3773.

Homicide Rate Trend (Marion County, 2012-2017)

The homicide rate in Marion County increased between 2012 and 2017, reaching its highest in 2016 (DR3774).

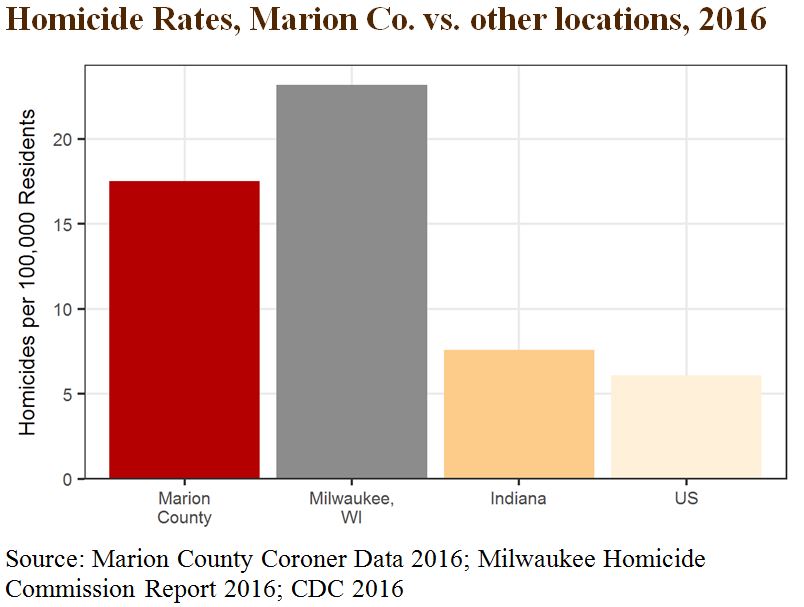
Homicide Rate Location Comparison (Marion County, 2016)

In 2016, the Marion County homicide rate was approximately twice as high as the Indiana state homicide rate. Additionally, the Marion County homicide rate was higher than the United States' homicide rate, yet lower than Milwaukee's homicide rate (DR3774).

Life Expectancy for Marion County by Race and Overall, 2007-2016

This graphs illustrates life expectacy for Marion County residents from 2007-2016, both overall and by two races-white and black. White residents had consistently higher life expectancy over this ten year period, DR3568.

Life Expectancy by Zip Code (Marion County, 2015)

This map illustrates life expectancy rates by zip code in Marion County in 2015 (DR3031).

Top Ten Causes of Death by Age (Marion County, 2016)

Accidents continue to be a top cause of death among middle age residents in Marion County, DR3563.

Marion County Postneonatal Infant Mortality Rates by Race/Ethnicity, 2007-2016

This graph illustrates post-neonatal infant mortality rates (age 28-364 days) for Marion County by race/ethnicity from 2007-2016 (DR3484).

Marion County Infant Mortality by Race/Ethnicity, 2007-2016

This graph shows infant mortality rates in Marion County by race/ethnicity from 2007-2016.