Birth Certificates

Related Content

The Consumption and Consequences of Alcohol, Tobacco, and Drugs in Indiana: A State Epidemiological Profile: 2018

Substance use continues to be a major public health concern, negatively impacting a variety of health, legal, and social outcomes. Nearly one-fourth of Hoosiers ages 12 and older engaged in binge drinking in the past month and one-tenth used an illicit substance. Furthermore, 7% of Indiana residents met criteria for substance use disorder (SUD) in the past year and 6.5% needed but did not receive treatment for their SUD.

Of particular concern is polysubstance use, or the use of two or more substances over a defined period, simultaneously or at differing times, for recreational purposes. In over 70% of admissions to substance use treatment in Indiana, the use of multiple substances was indicated, with 30% reporting the use of two drugs and nearly 41% reporting the use of three drugs.

During state fiscal year 2018, a total of 10,483 children were removed from their parents by the Department of Child Services in Indiana; almost two-thirds (64%) of these removals were due to parental alcohol and/or drug use.

Medicaid Births by Zip Code (Marion County, 2013-2017)

Medicaid Births in Marion County, by zip code, ranged from 16.8% in 46220 to 83.1% in 46241 during 2017 (DR4013).

Medicaid Births by Zip Code (Marion County, 2013-2017)

Medicaid Births in Marion County, by zip code, ranged from 15.2% in 46077 to 86% in 46218 during the period 2013-2017. [DR4013]

Adolescent Pregnancy Rate by Race_Ethnicity (Marion County, 2012-2017)

The adolescent pregnancy rate has decreased from 2012 to 2017 in Marion County. Hispanic teens have the highest rates, followed by Black non-Hispanic female teens. From 2016 to 2017, the adolescent pregnancy rate decreased for all races, but increased for Hispanic adolescents (DR3841).

DR3737 MCPHD 2016-2017 community report tablesDR3737 MCPHD 2016-2017 community report natality & infant mortality tables.doc

Neonatal and infant mortality rates among racial/ethnic minority residents were higher than among White residents of Marion County during 2016 and 2017. Black residents carried the highest burden of disease with rates more than twice that of White residents (DR3737).

Maternal Smoking Rate by Race/Ethnicity (Marion County, 2006-2016

The maternal smoking rate among Marion County residents was highest among whites, followed by black and Hispanic residents (DR3484).

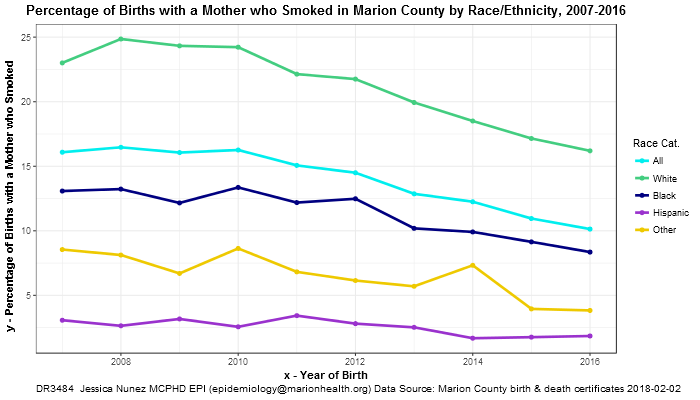
Maternal Smoking Rates in Marion County by Race/Ethnicity, 2007-2016

This graph shows the percentage of mothers who smoked during pregnancy by race/ethnicity from 2007-2016. During this period, white residents had the highest prevalence of maternal smoking, followed by black residents. Maternal smoking steadily declined during this period, DR3484.

Preterm Births in Marion County by Race/Ethnicity, 2007-2016

This graph show the percentage of premature births (less than 37 weeks) in Marion County, by race/ethnicity, from 2007-2016 (DR3484).

Prenatal Care Initiation in Marion County by Race/Ethnicity, 2007-2016

This graph illustrates the percentage of mothers who initiated prenatal care in the first trimester from 2007-2016. During this period, non-Hispanic white women were more likely than their minority peers to have received prenatal care during the first trimester of their pregnancy (DR3484).

Very Low Birth Weight Births in Marion County by Race/Ethnicity, 2007-2016

This graph show the percentage of very low birth weight births (less than 1,500 grams) in Marion County, by race/ethnicity, from 2007-2016 (DR3484).

Marion County Low Birth Weight Births by Race/Ethnicity, 2007-2016

This graph shows the percentage of low birth weight births (less than 2,500 grams) in Marion County from 2007-2016. African Americans had the highest rate of low birth weight births for all years reported (DR3484).

Marion County Mothers who Breast Fed Upon Hospital Release by Race/Ethnicity, 2007-2016

This graph shows the percentage of Marion County mothers who breast fed upon hospital release, by race/ethnicity, from 2007-2016 (DR3484).

Marion County Postneonatal Infant Mortality Rates by Race/Ethnicity, 2007-2016

This graph illustrates post-neonatal infant mortality rates (age 28-364 days) for Marion County by race/ethnicity from 2007-2016 (DR3484).

Marion County Infant Mortality by Race/Ethnicity, 2007-2016

This graph shows infant mortality rates in Marion County by race/ethnicity from 2007-2016.